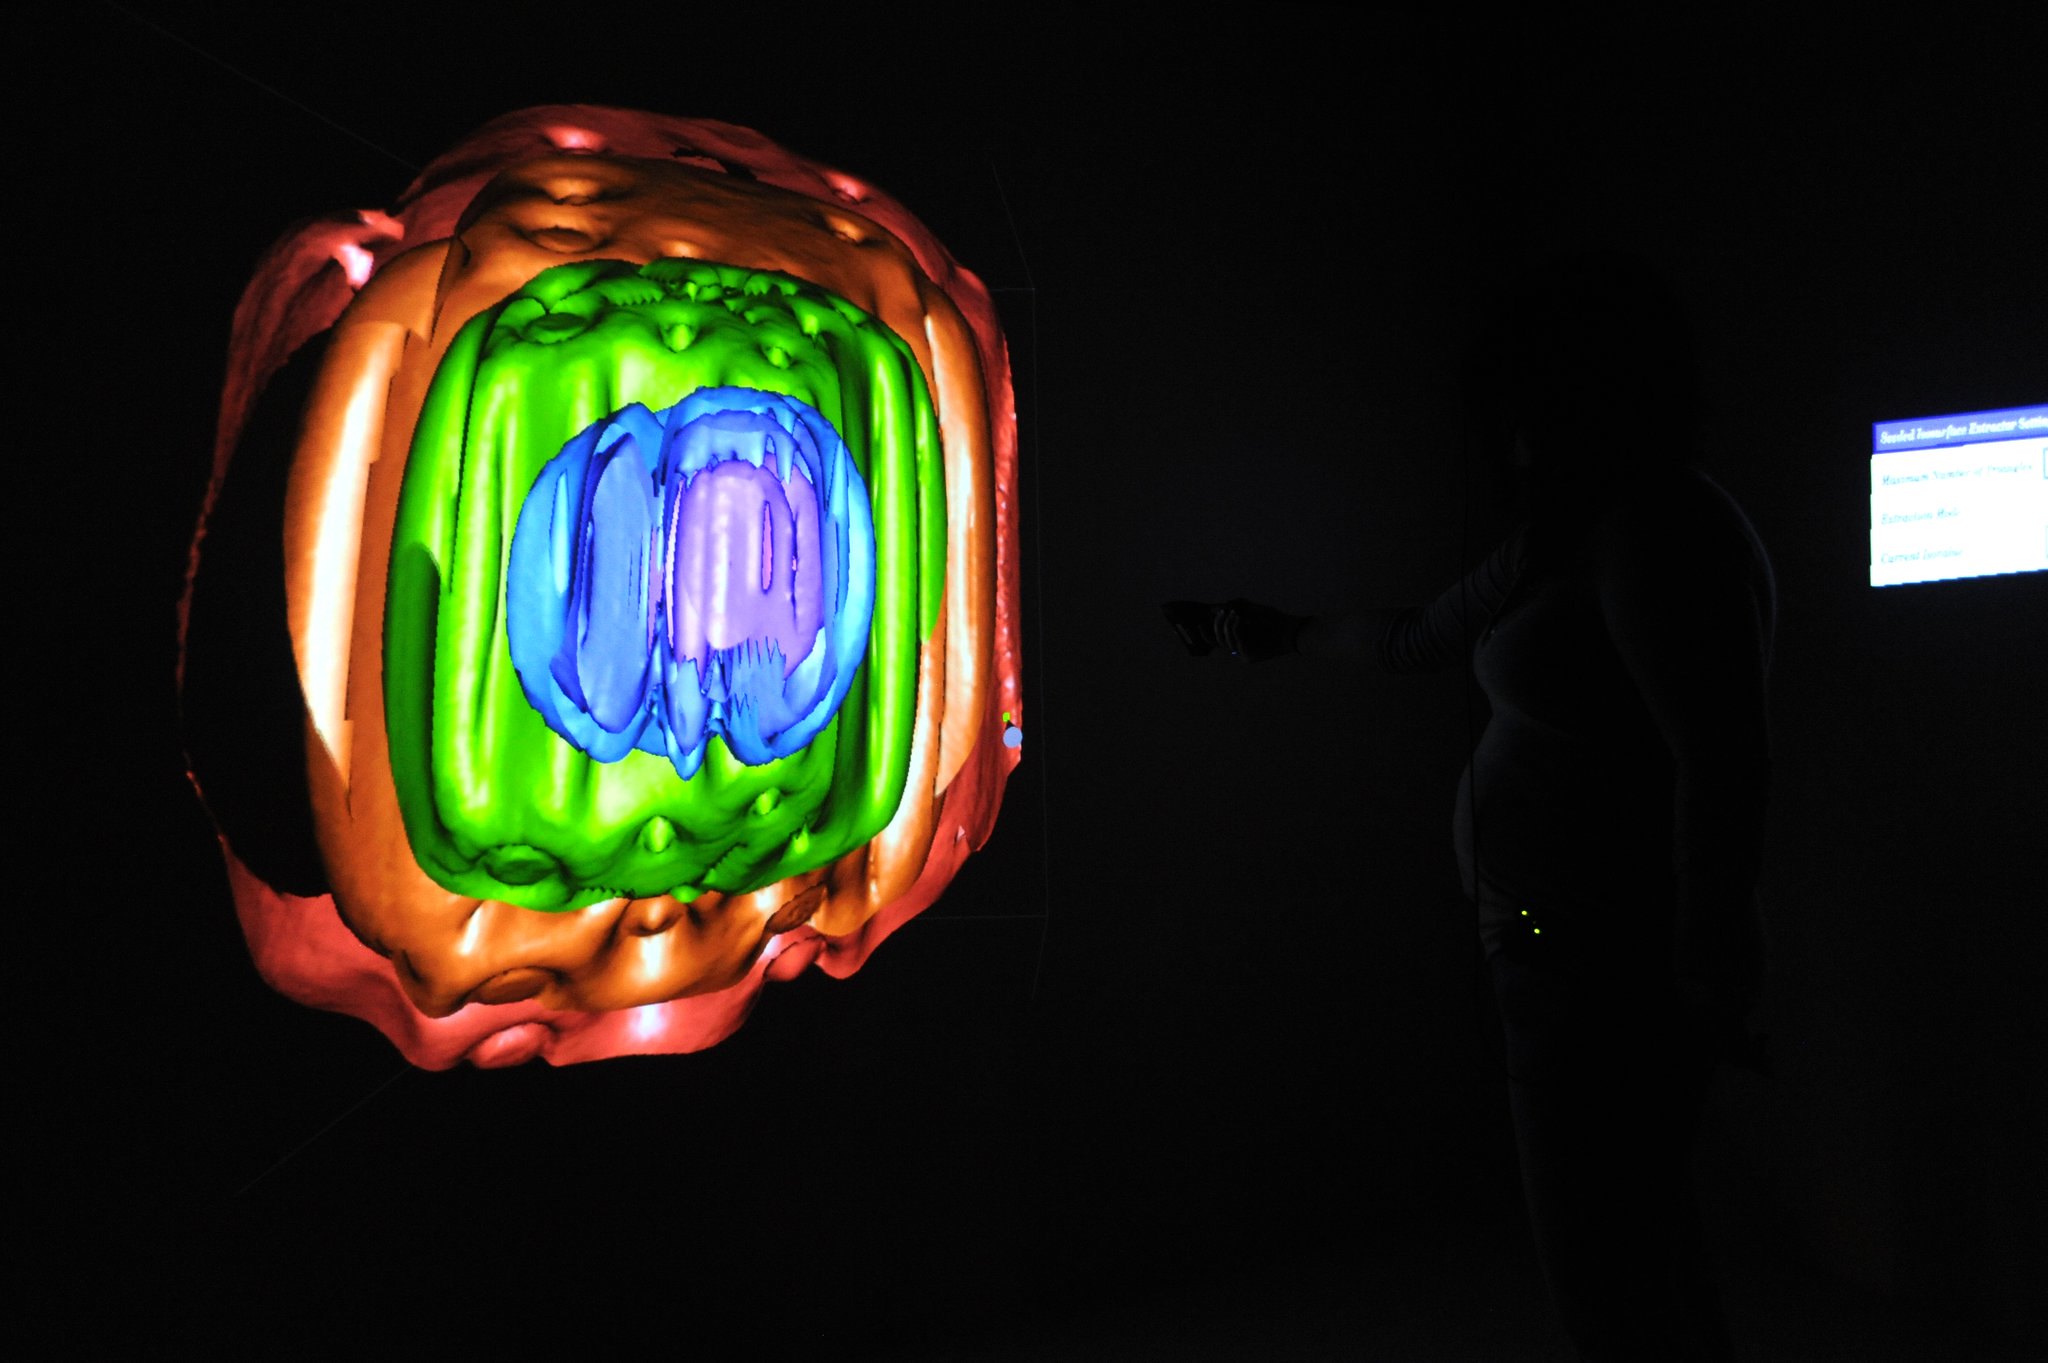
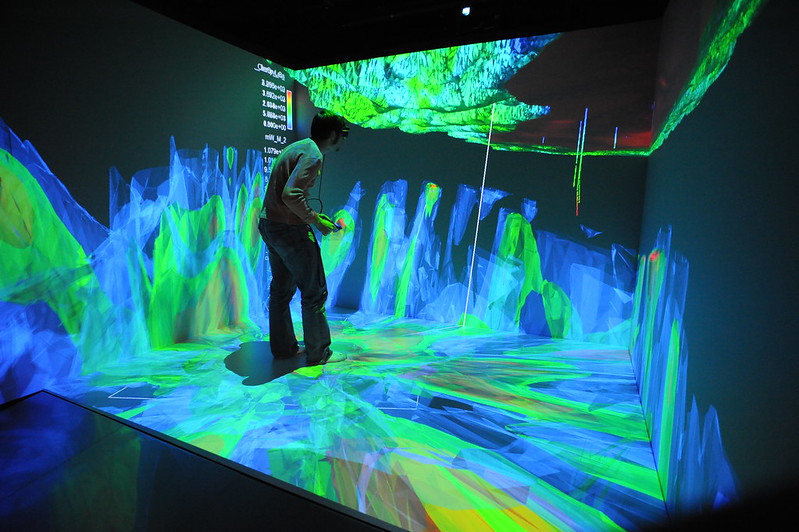
The Applied Visualization Laboratory contains several 3D immersive environments for scientists and engineers to walk into their data, examine it, and provide deep analysis in pursuit of their research.
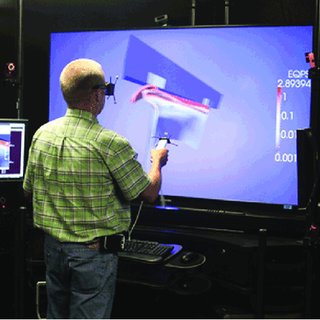
As mixed, virtual, and augmented reality technology evolves, the opportunities for portable, in-depth analysis of complex data sets increases. Augmented reality solutions are envisioned to allow researchers to have CAVE-like experiences anywhere. Web-based 3-D geographic information systems, mobile applications (for both phone and tablet) and serious games (games built for training or educational purposes) allow users to conduct research at their desks or in the field, enabling discovery outside the lab. Virtual reality exploration systems offer the ability to create visualizations of large data sets that can be projected and run in real-time simulations. Using six-degrees-of-freedom input devices — which allow a body to move forward and backward, up and down, left to right — and stereoscopic output, they offer the benefits of more realistic interaction.
The Center for Advanced Energy Studies (CAES) opened its first Cave Automatic Virtual Environment (CAVE) in 2010. With the new CAVE installed in 2017, CAES's Applied Visualization Laboratory is even better equipped to provide researchers from universities, industry and government agencies with a user facility where they can visualize and address scientific and technical challenges.

Recent News
- Xingyue Yang is presenting her work titled "3D Virtual Simulation for Radiation Safety and Survey Training" at CAAV Conference, 2021
- Rajiv Khadka is presenting his work titled "Mobile Hot Cell Digital Twin using Immersive Virtual Environment" at CAAV Conference, 2021
Recent Publications
- Khadka, R., Koudelka, J., Kenney, K., Egan, E. Casanova, K., Hillman, B., Reed, T., Newman, G., & Issac, B. (2022, March). Mobile Hot Cell Digital Twin: End-of-life Management of Disused High Activity Radioactive Sources — 22057. In Waste Management Symposia (WMS). (accepted)
People

John Koudelka
Applied Visualization Laboratory Lead

Rajiv Khadka
Visualization Researcher

Xingyue Yang
Visualization Researcher

Nathan Woods
Visualization Researcher

Porter Zohner
Data Analytics and Visualization Professional

Shane Grover
Hardware Engineer and Data Analyst

Shad Staples
AI Data Analytics and Visualization Department Manager
Portfolio


Virtual AVL
Equipment
Cave Automatic Virtual Environment (CAVE)
Four-panel system — 12'x12'x7.5',
Rear Digital Projection
Inexpensive Interactive Immersive Interface
(I-quaded or IQ) Station
A low cost mobile solution similar to the CAVE
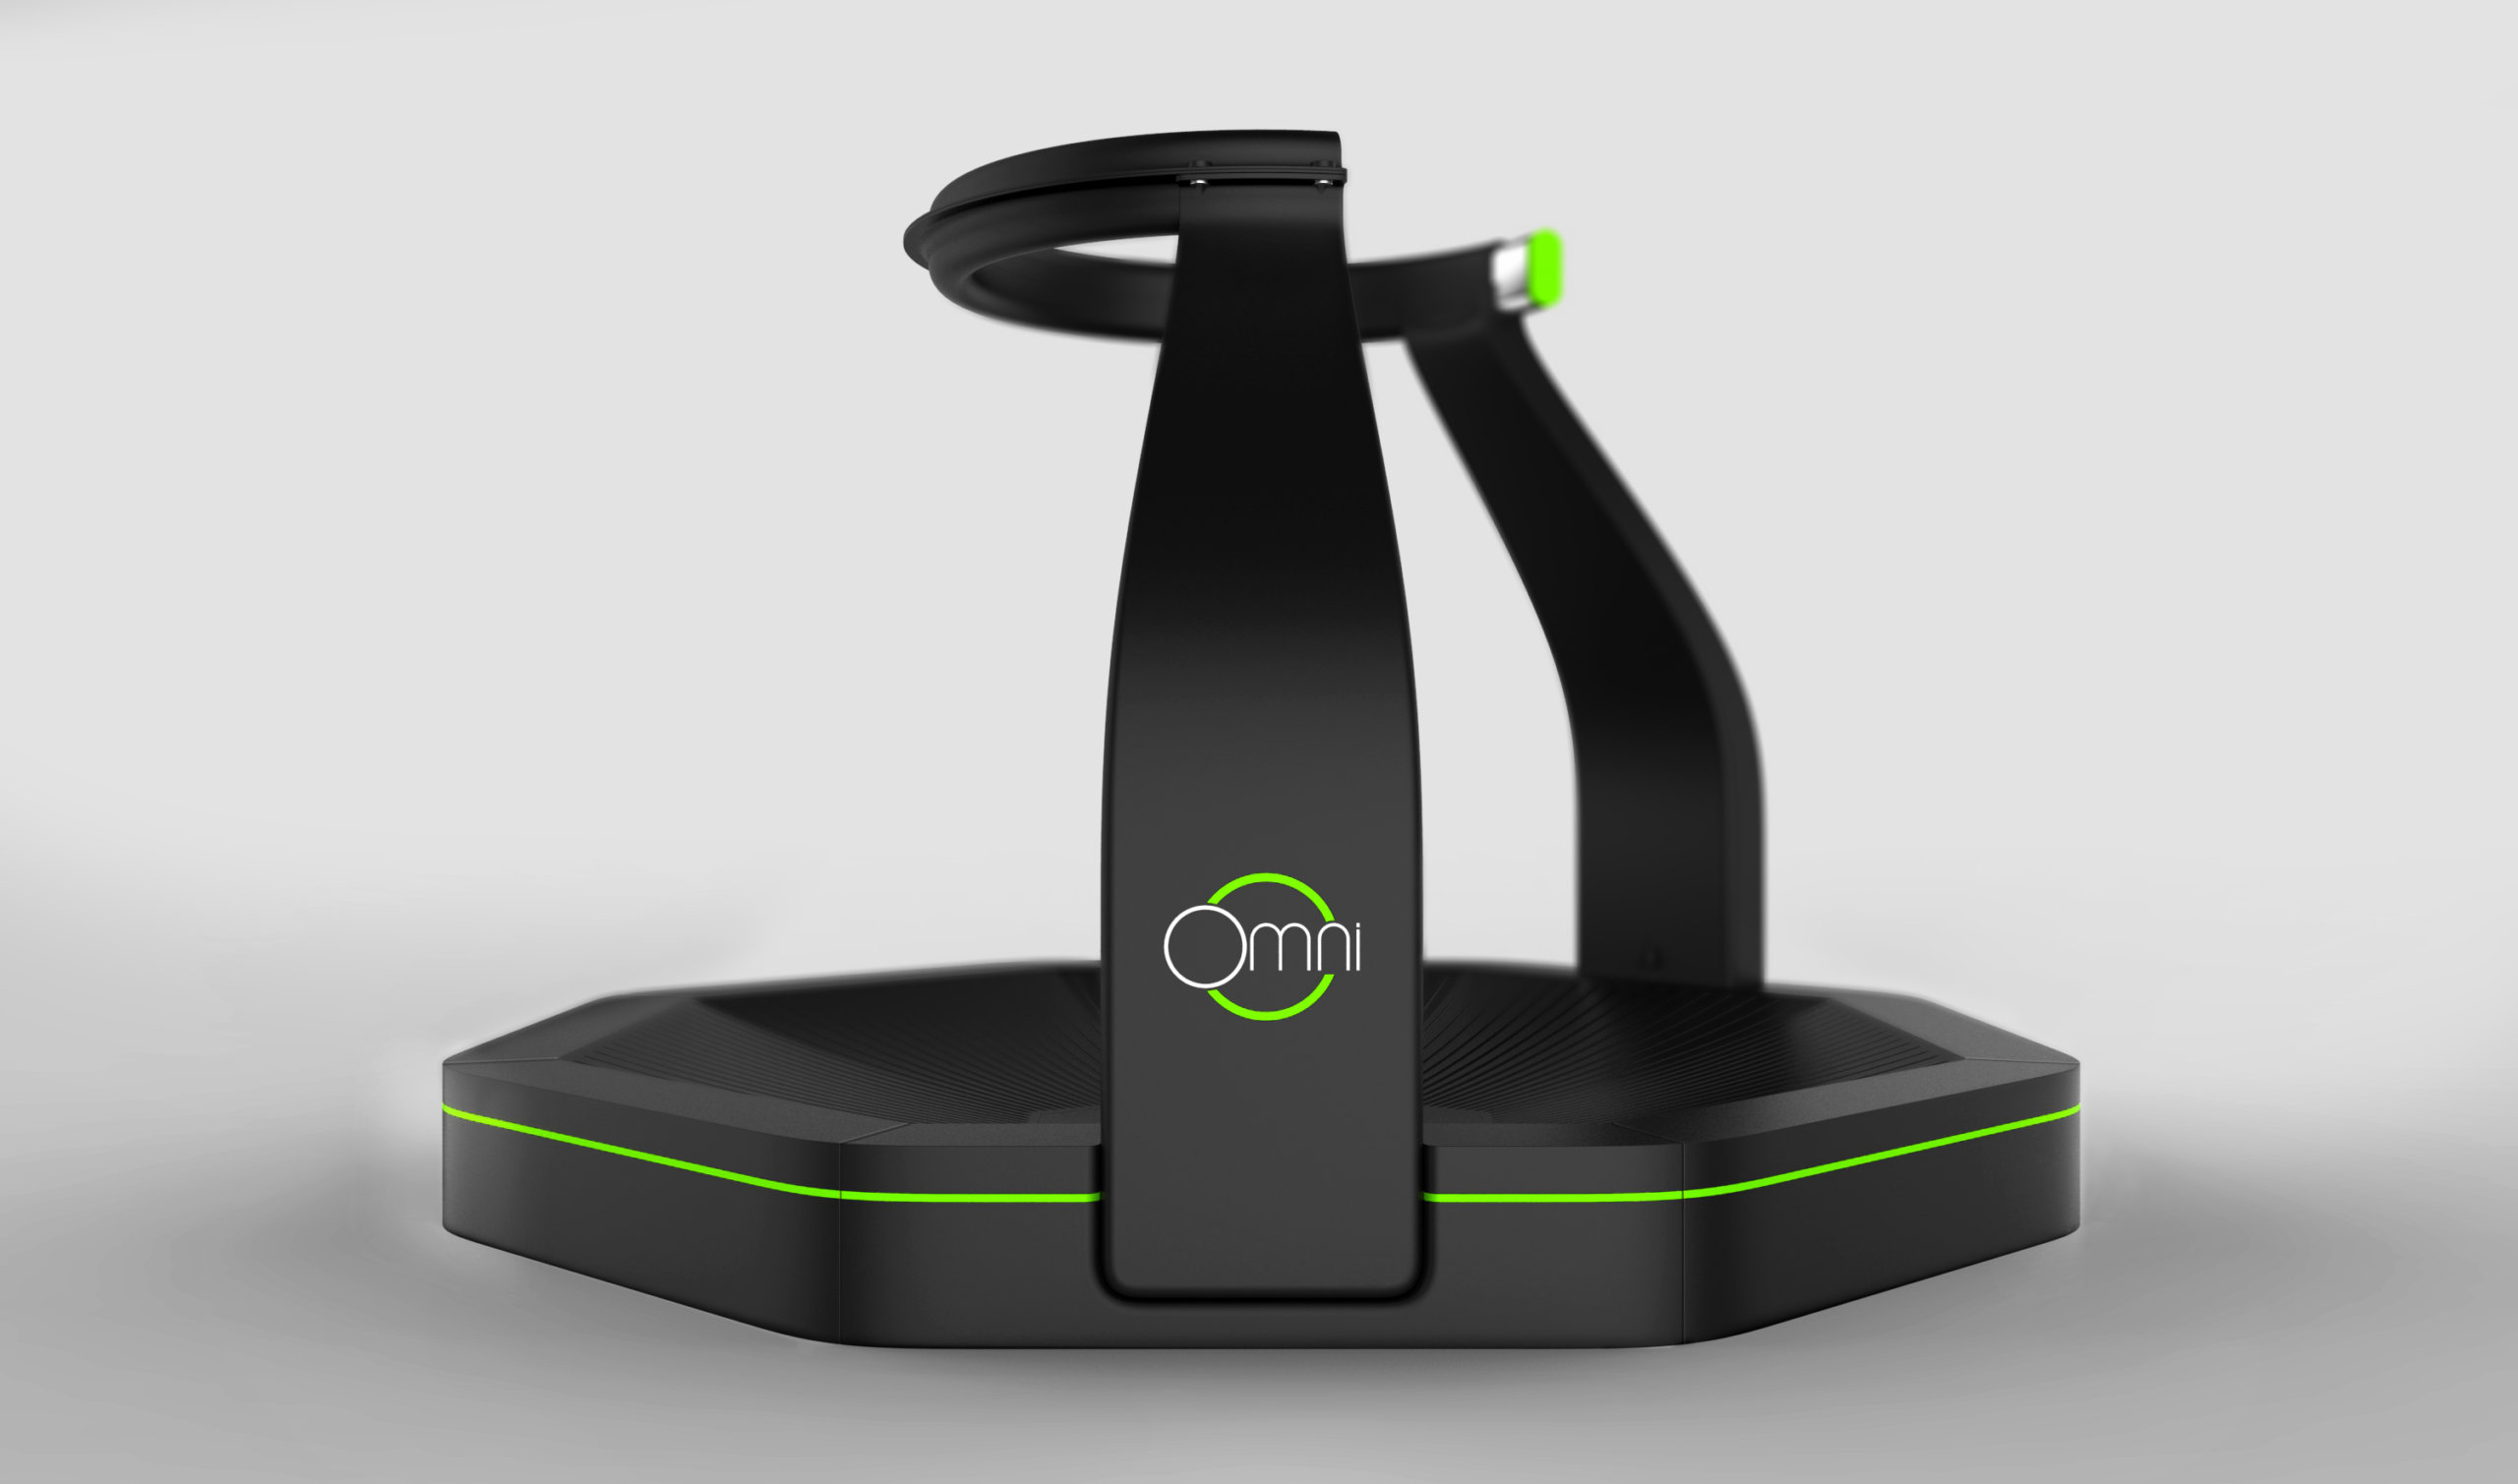
Virtuix Omni TreadMill
It provides platform to simulates locomotion for virtual reality games and application
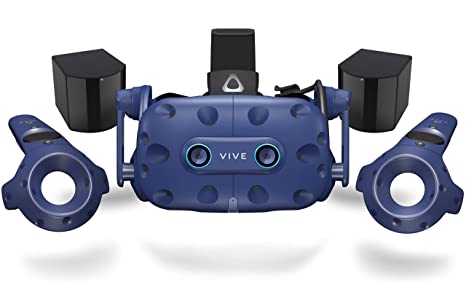
HTC VIVE Pro
A virtual reality headset to view virtual environment and interact with the environment using controller
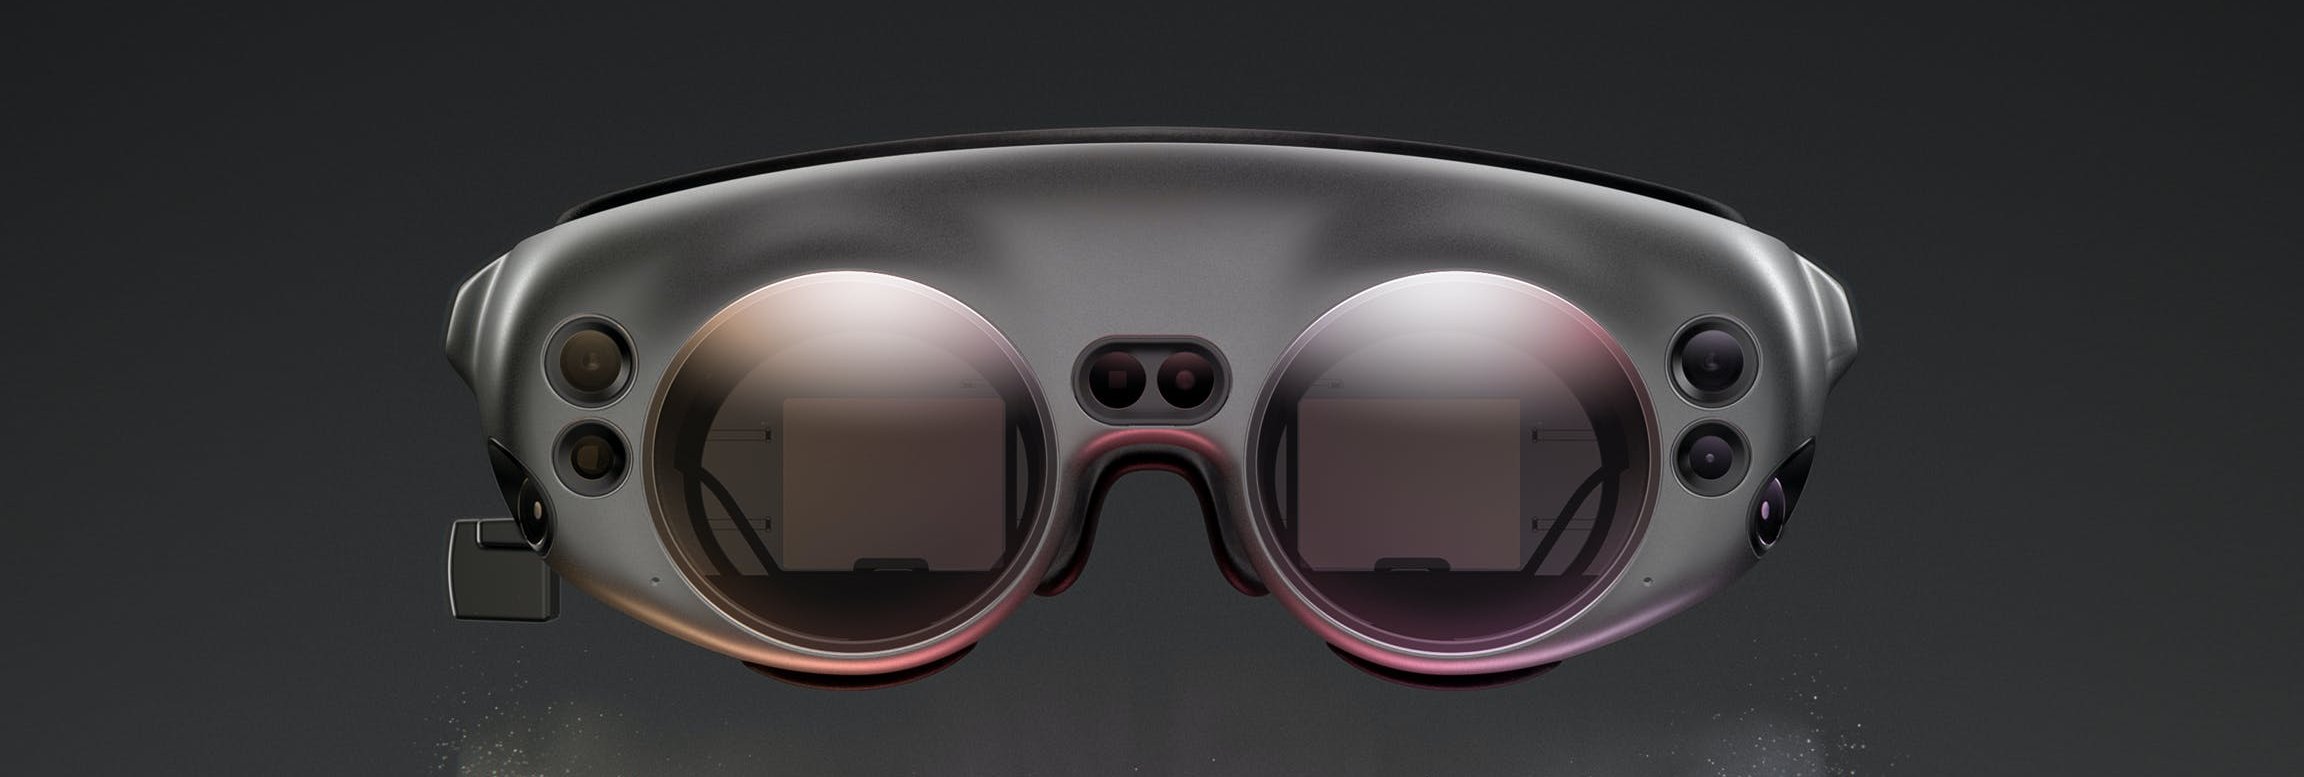
Magic Leap
Augmented Reality headset to augment the virtual information on top of the real world
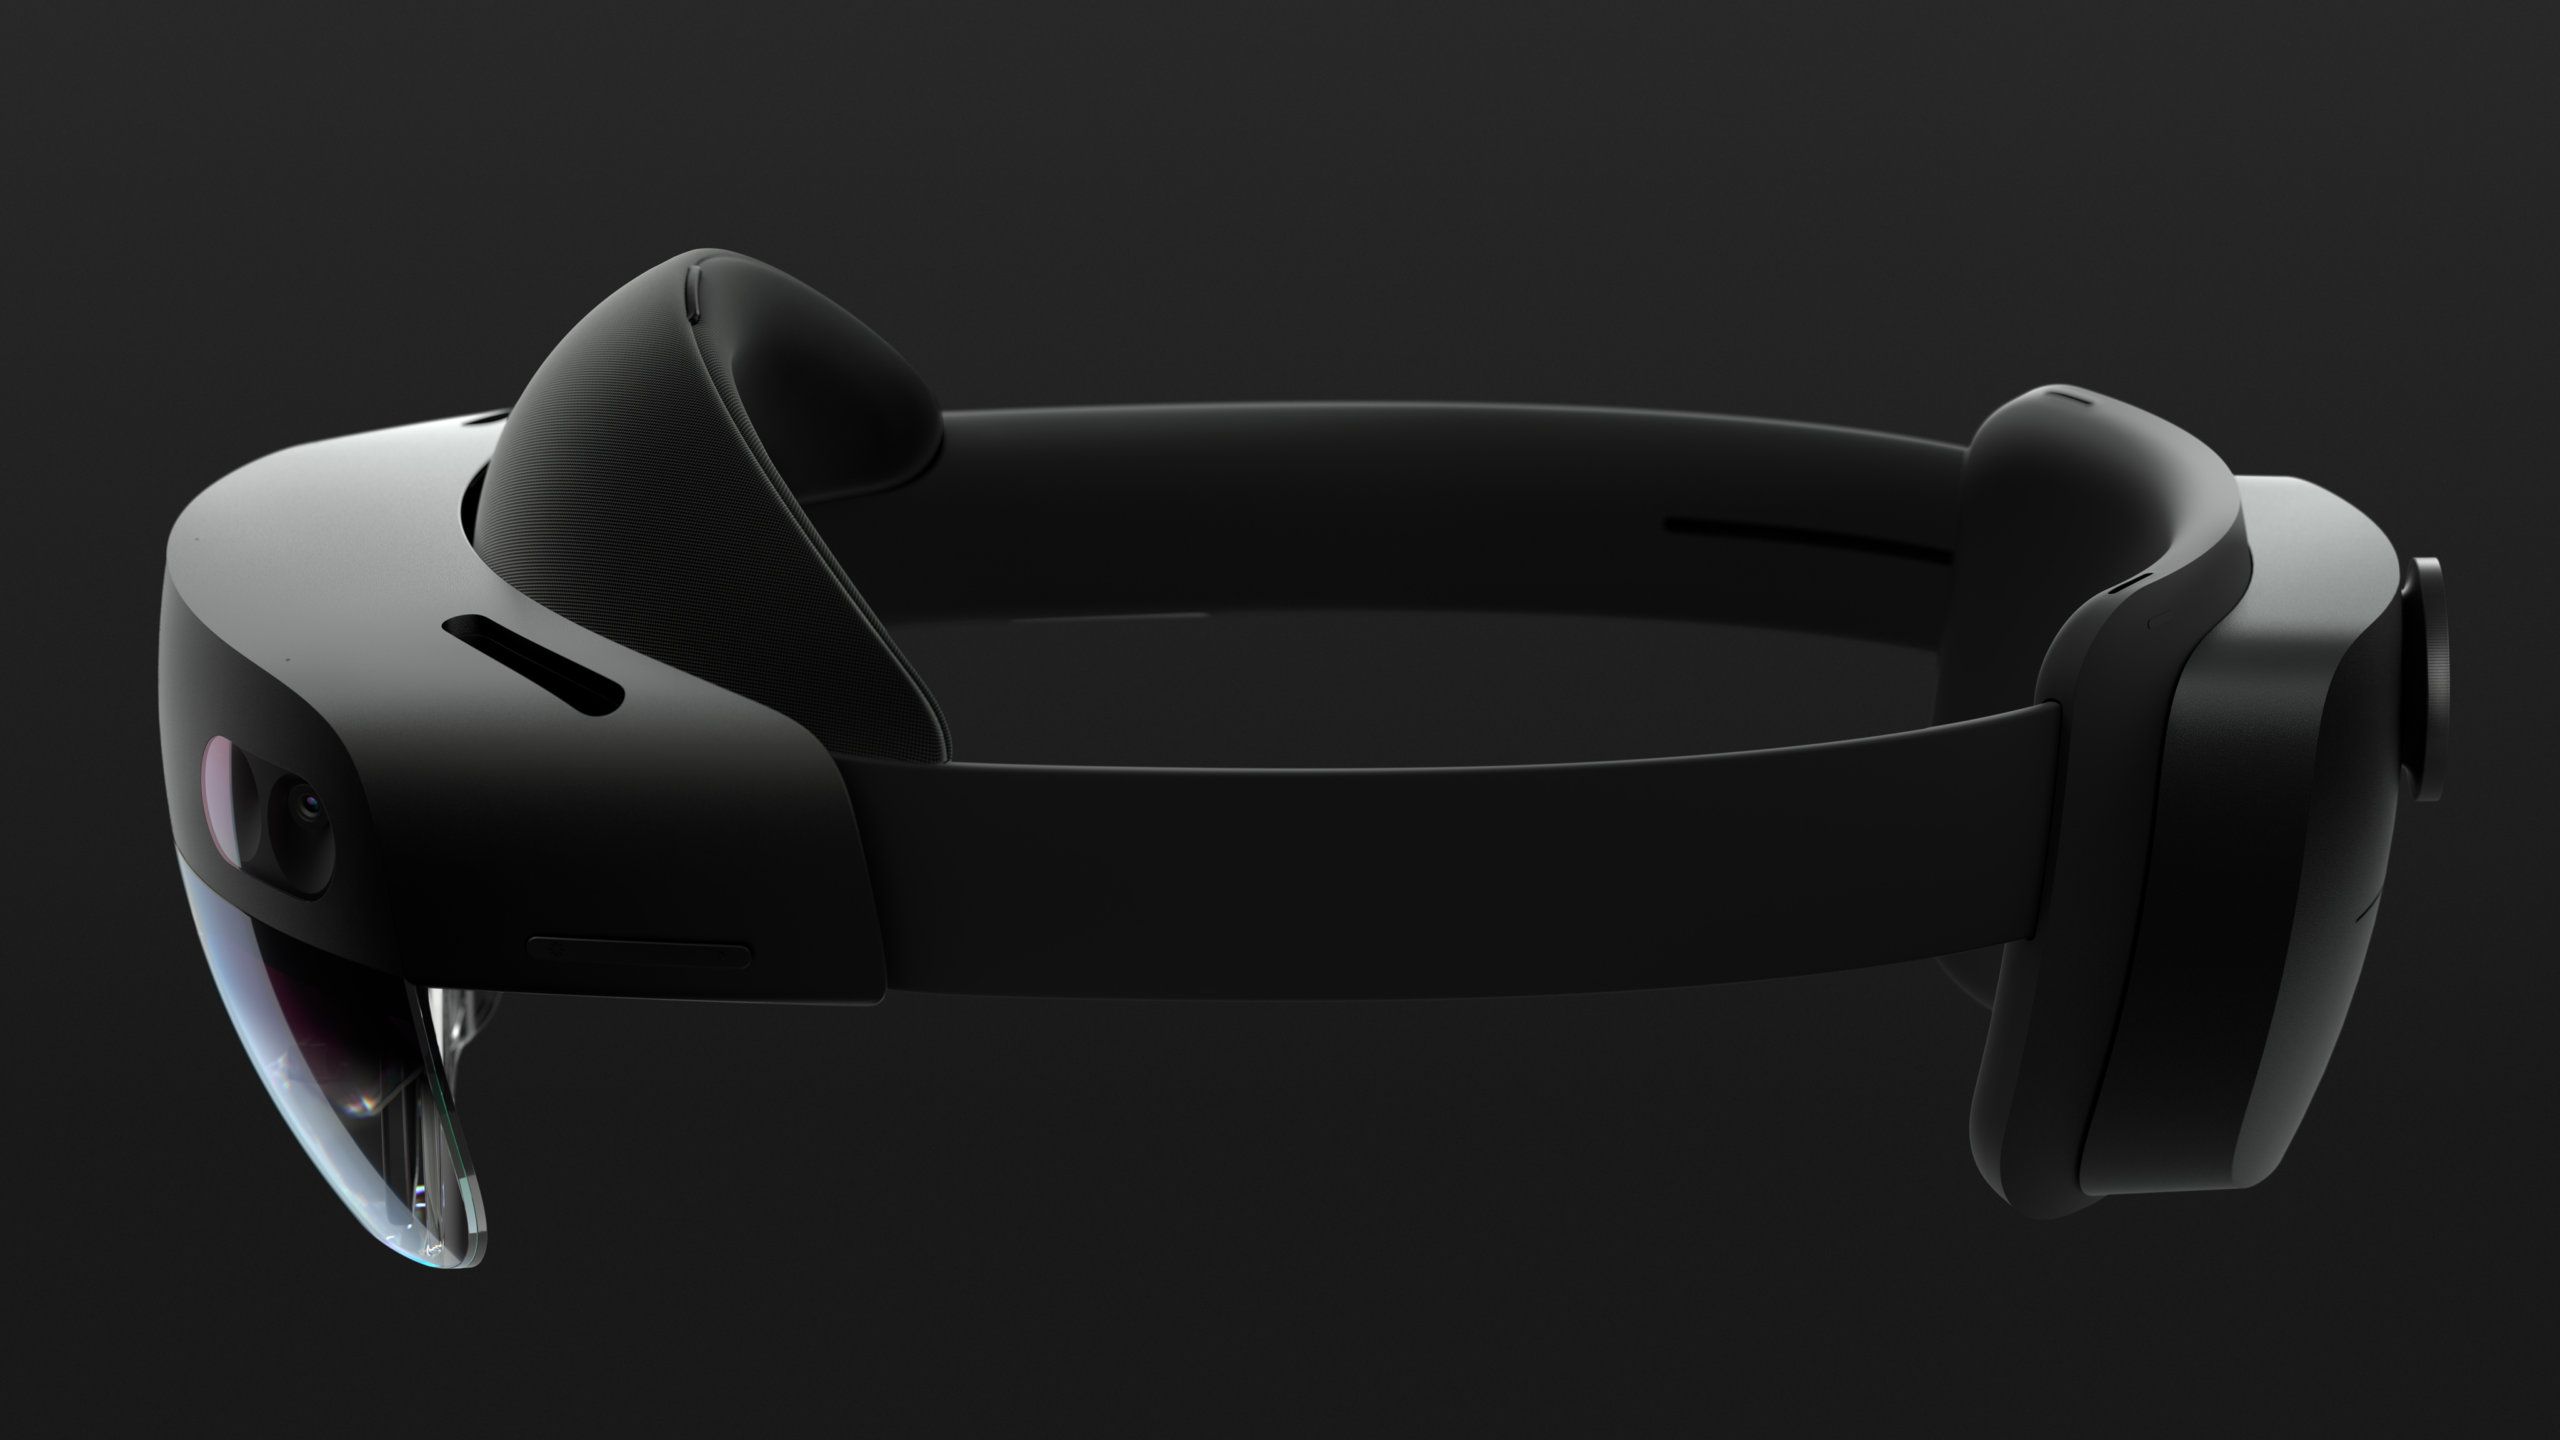 Microsoft Hololens 2
Augmented Reality headset to augment the virtual information on top of the real world
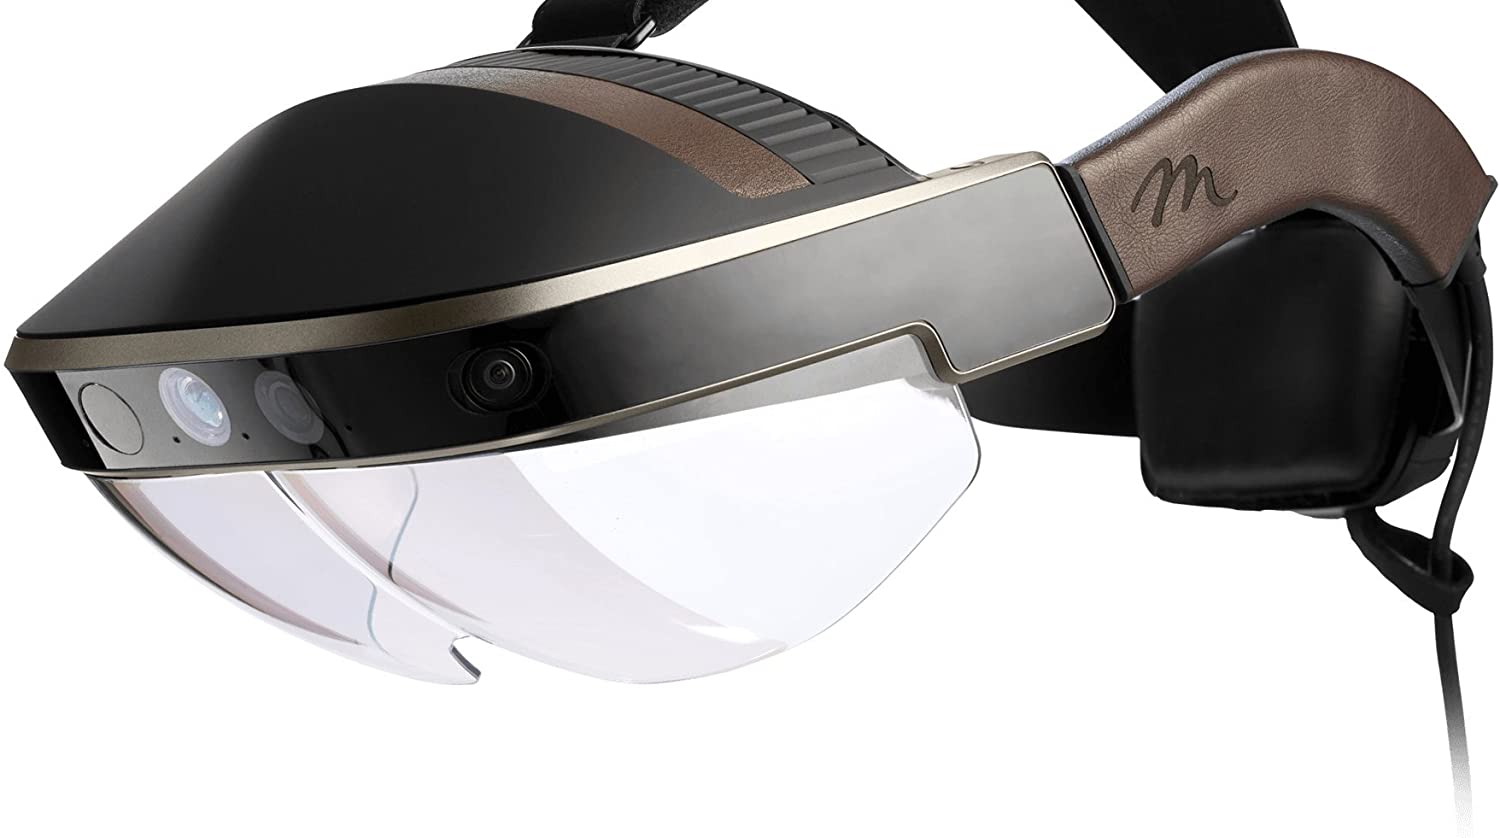
Meta 2 Headset
Augmented Reality headset to augment the virtual information on top of the real world

Ipad/Tablets/SmartPhones
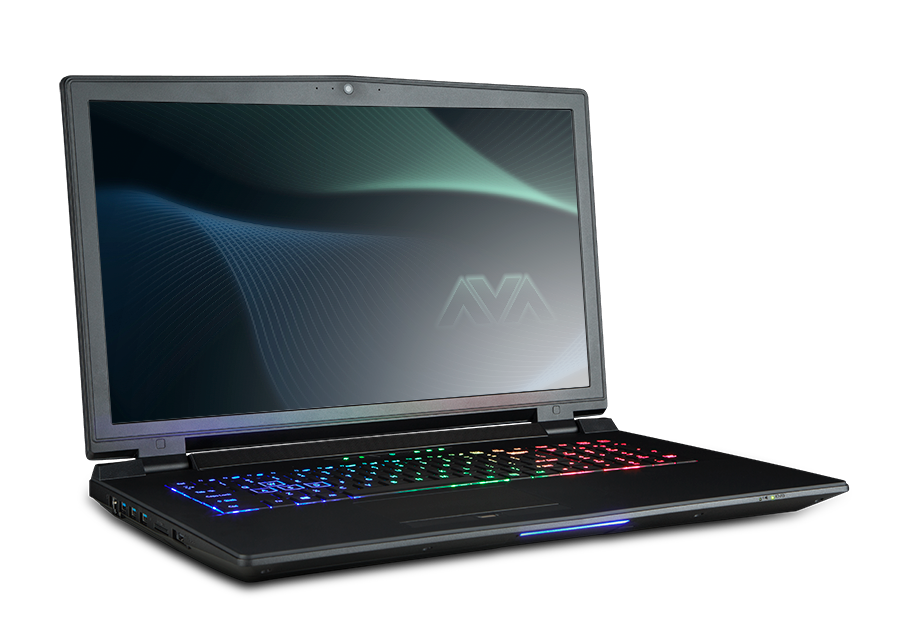
Laptops/Desktop Machine
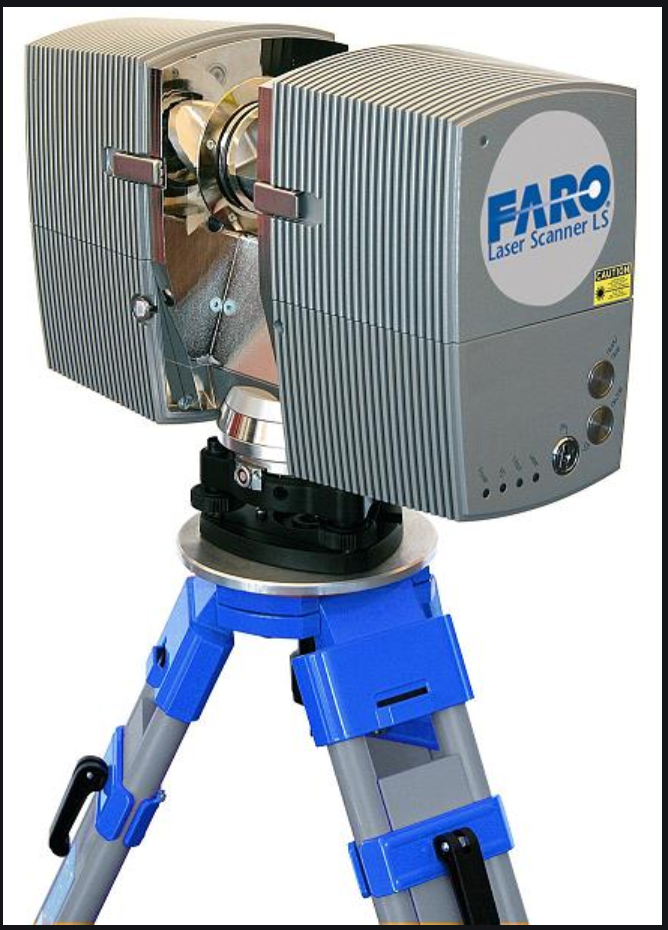
Lidar Faro Scanner
Laser scanning tools to capture exterior and interior scenes
Software


![]()
![]()
![]()
![]()


Location

